Sensitive data map: data discovery and classification
Learn what a sensitive data map is, how automated data discovery locates sensitive data in business databases, and why it is the essential first step.
Proper data management has gained growing weight in organizations. Operational needs and regulatory requirements, especially those concerning protection and privacy, have driven initiatives aimed at efficient data governance. All of them share a prerequisite: knowing which data is handled and where it is.
Most organizations know they handle sensitive data in their databases. Far fewer know precisely where it is, in which tables, under which field names and in which format. Over time, business systems fill up with applications that differ in technology, design and purpose, documentation falls out of date at the same pace as new capabilities are developed, and the data passes through the hands of teams who are often no longer with the organization. The result is a large data model, frequently in the order of thousands of tables, of which nobody keeps a complete view.
Organizations keep data of interest in many places, but it is the databases of business applications that draw the attention, because of the volume of information they handle and their importance to operations.
In this context, the sensitive data map answers the initial question by defining the exact location of the information the organization must protect. It is the essential first step of any serious data governance, regulatory compliance or environment preparation initiative.
What a sensitive data map is
A sensitive data map is an inventory of the location of the data that requires protection within an organization’s databases. It is part of a broader concept, the map of data of interest, which brings together every category of information relevant to the business.
Data of interest covers categories such as first names and surnames, identity documents, postal addresses, phone numbers, email addresses, company names, bank accounts, credit and debit cards, IP addresses, URLs and vehicle registration numbers. Sensitive data is the subset of that list which, by its nature or by regulatory requirement, carries the highest protection priority.
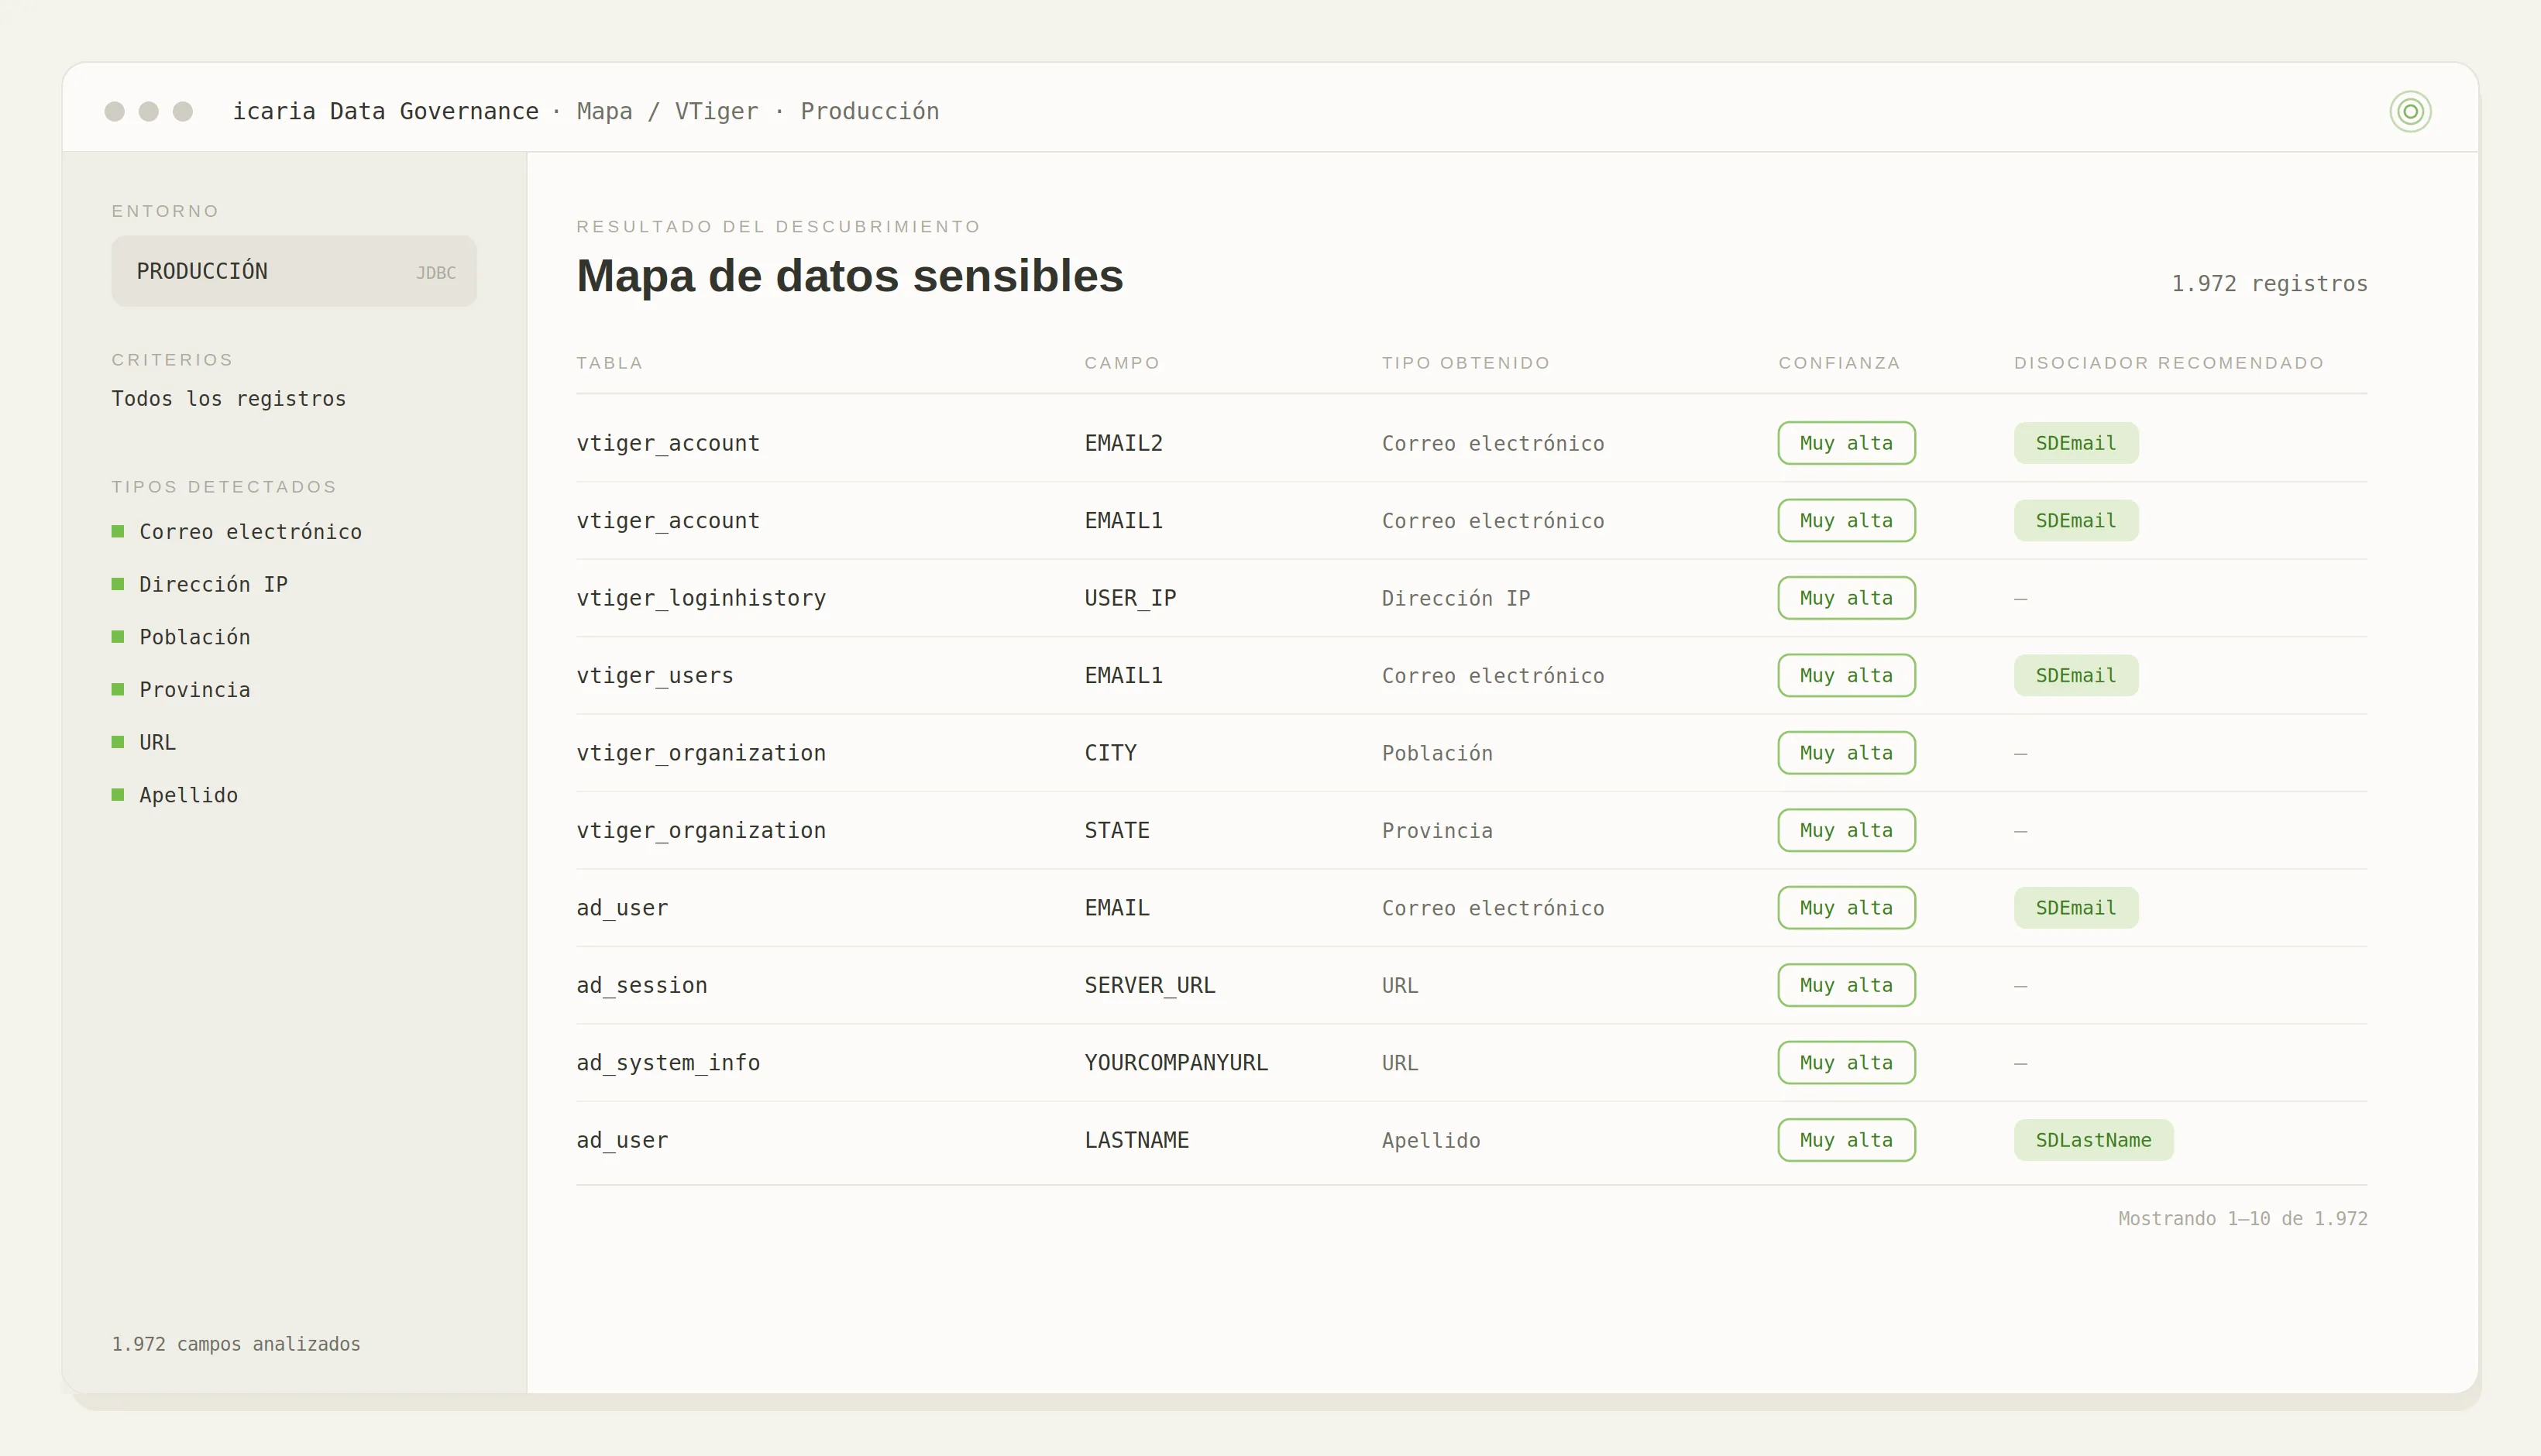
For each field identified, a useful map records four elements:
- The location, expressed as schema, table and field, shows where the information resides.
- The type of sensitive data detected and the evidence that led to flagging the field as a candidate.
- The anonymization suggestion, the algorithm recommended to protect the content of that field.
- The confidence level, the percentage of records read that meet the conditions to be considered sensitive data, a measure of how likely the field is to actually contain sensitive information.
Alongside the fields that contain sensitive information, the map also lists those that, without containing it, point to its presence in the table, so the possibility of sensitive data is also known indirectly.
Building and maintaining this inventory by hand is not feasible in an organization of any size. There are data governance tools that build it automatically, such as icaria Data Governance through its Data Discovery module, which locates data of interest in the databases of business applications. The following sections explain how the tool solves this problem: where it looks for the information, why the manual approach falls short, how discovery works and what the map enables once it is available.
Where the data is searched for
Discovery focuses on the databases of the organization’s management applications, where most of the sensitive information is concentrated. It is worth specifying what a management application means in this context. It is the business software that models and runs repeatable business processes, such as sales, purchasing, finance, inventory, human resources or customer service. It operates on common master data, such as products or parameters, and on instance data, such as customers, contracts or accounts. These applications, and the databases behind them, are the object of discovery.
How easy and how precise discovery is depends largely on how each application stores its data. Standard off-the-shelf products usually have a normalized data model and standardized naming and design patterns, which makes detection more direct. Custom developments tend towards more irregular normalization and divergent design patterns, and usually have less documented knowledge available, which calls for more configuration and more iterations to reach a reliable result.
That is why, when icaria Data Governance is implemented, the data sources are connected and the model is imported before the first analysis: the tables, their relationships, fields and types. The scope is agreed with the application teams, who confirm which tables are relevant. Involving those teams from the start makes the rest of the project easier.
Obstacles and difficulties of manual data discovery
Approaching discovery manually involves several obstacles at once:
- Time. The model often spans thousands of tables and changes at the pace at which new capabilities are developed. Reviewing them field by field is slow and costly, and a hand-built inventory is rarely up to date.
- Spread across multiple applications. An organization runs many applications and databases that differ in technology, design and purpose, each with its own naming and conventions. Knowledge is scattered and, often, the people who designed the model are no longer with the organization.
- Storage format. The way data is stored alters its structure and makes it harder to recognize by its natural pattern.
The third obstacle deserves a concrete example. A single field, called for example documento, stores both a customer’s national ID number and their passport number. As the two are not the same length, the shorter one is padded to fit. That padding alters the format of the data, which no longer matches the natural pattern of a passport number. It is a minor and very common case that reveals the underlying problem: the way data is stored alters its structure.
Some types require additional adjustments for accurate detection. A numeric customer or employee identifier, for example, can be confused with other auto-generated numeric keys and needs specific rules. Correctly recognizing data types under these conditions requires a mechanism able to adapt to the particularities of each organization.
How automated data discovery works
Data discovery in icaria Data Governance combines two complementary analyses. The first examines the names of the fields in each table. The second analyzes the actual content stored in them. The two results are evaluated together and produce a report with the fields that probably contain sensitive data and those that, without containing it, suggest its presence. A table with a city and a postal code, for example, makes it likely that an address exists too. The map uses that association to flag the possible presence of sensitive information indirectly.
The work is done by inspectors, configurable detection agents. icaria Data Governance includes generic inspectors for the most common data types and lets you create new ones or change the behavior of the process to fit the characteristics of each model. For each inspector you can configure the keywords that indicate a high probability of sensitive information, the character strings to ignore (for example, so that a numeric ID_CLIENTE field does not produce a false positive where the name CLIENTE would), the expected length of the field and of the data it contains, the weighting between the name analysis and the content analysis, and the sensitivity threshold above which a field is reported. When several inspectors flag the same field, the result with the highest confidence prevails.
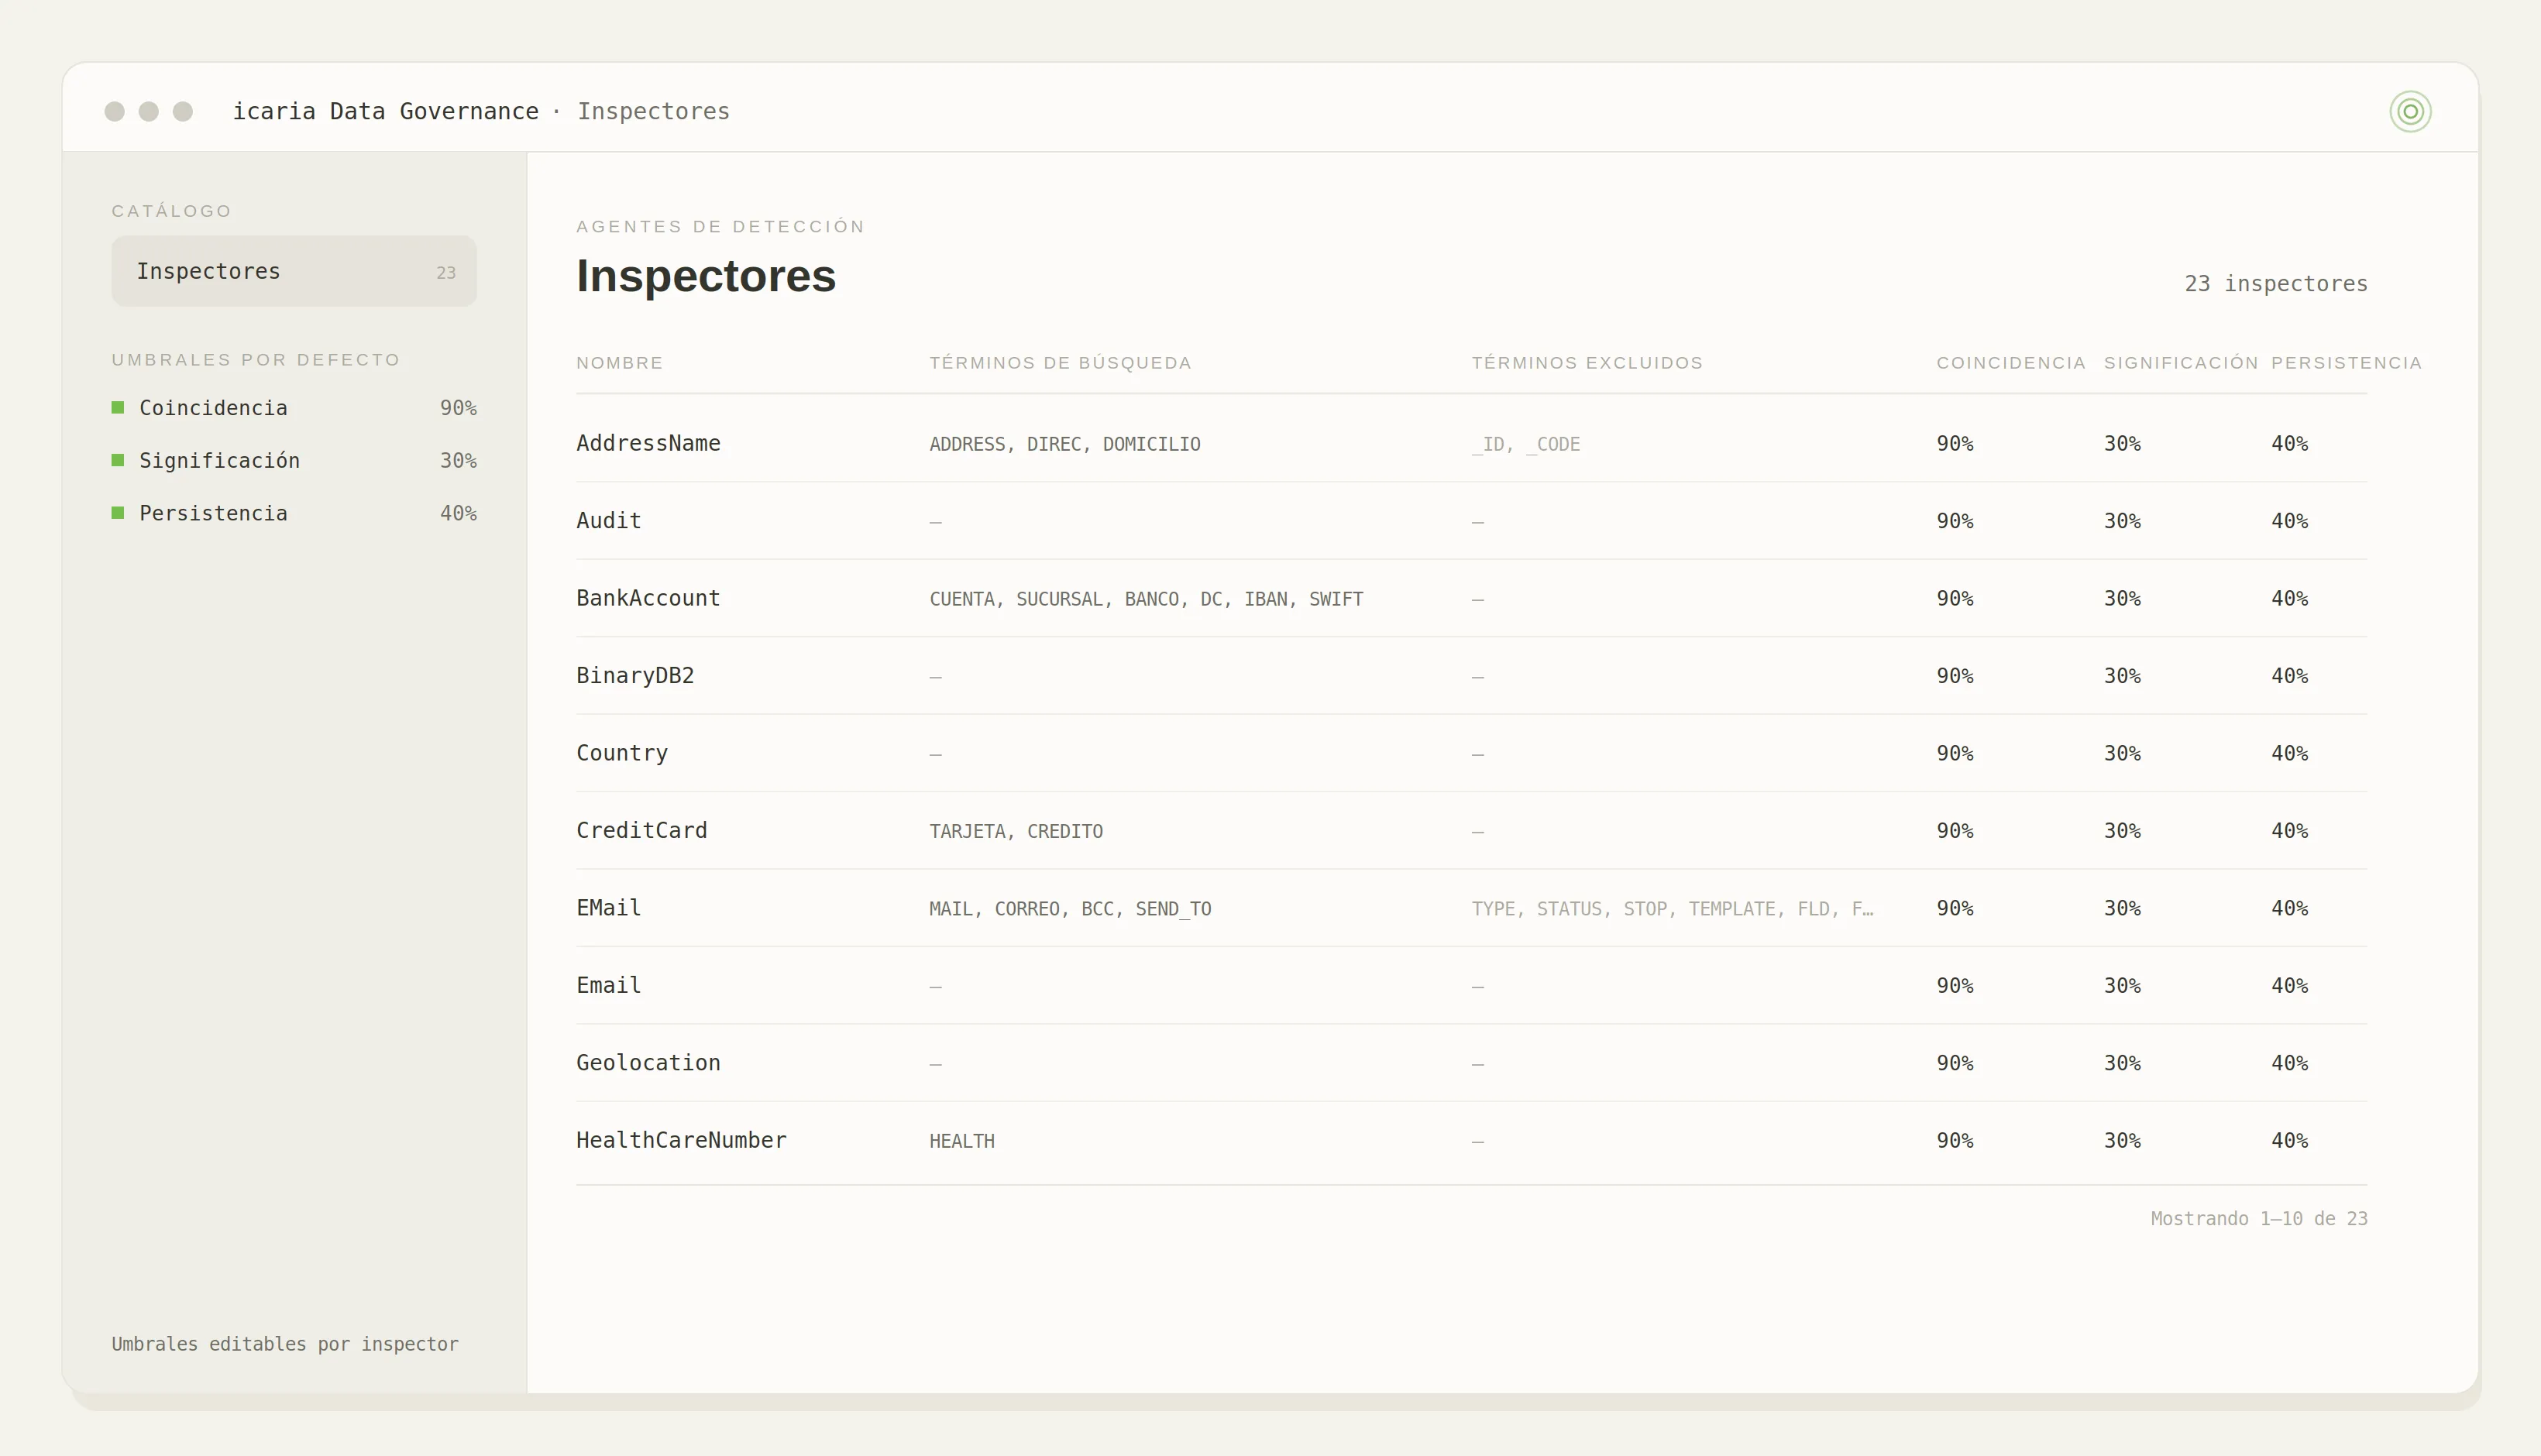
To refine detection in fields whose header does not identify their content, inspectors are trained with examples. The organization provides tables and fields with sensitive information that feed the inspector’s recognition. When those examples are not available, the tables in which the previous analysis found indications are inspected manually, and the inspectors are adjusted based on that inspection.
The result of this process is the sensitive data map mentioned above. It is a report that brings together, for each database examined, the list of candidate fields with their location, the type of data detected, the suggested anonymization and the confidence level, together with the fields that indirectly point to sensitive information. The map can be viewed in the platform itself or exported to a file to annotate it, review it or share it with the teams involved.
An iterative process
Discovery is an iterative process, and the first run does not deliver a final result. The first analyses produce false positives and miss some fields, because each organization stores its information in its own way. Based on those results, on quick queries against the tables and on feedback from the teams, the parameters and inspectors are adjusted to obtain increasingly precise reports, which reduce false positives and leave out as few fields as possible. The approach is cautious: tolerating some false positives is preferred to missing a sensitive field.
Two or three cycles are usually enough to faithfully reflect the metamodel, the naming standards and the formatting quirks. During the process it is common to find data stored in very particular ways that do not follow the standard. These cases require customizing the anonymization mechanisms so that, once processed, the data still looks as real as the data in production environments.
The analysis should be run periodically. Databases evolve with the needs of the business, and with them comes new information that may require protection. As long as the naming and data entry criteria do not change drastically, the inspectors already configured remain valid.
From the map to data governance and data productization
The sensitive data map organizes an organization’s knowledge about its data and makes it actionable. From it, icaria Data Governance builds the metamodel that describes how business concepts are represented in each data source and store, improves the quality, oversight and assignment of responsibilities over that data, and shares the business concepts with the processes that represent them, which helps align the organization. It is the foundation on which data governance rests.
The same map enables other initiatives that depend on knowing exactly where the information is. Notable among them are environment anonymization, data preparation for development and testing, meeting privacy obligations and implementing measures to improve data quality.
This is especially important because, according to Gartner, poor data quality costs organizations an average of $12.9 million a year.
In conclusion, knowing where sensitive data is located is the precondition for protecting and governing it. The Data Discovery module of icaria Data Governance automates that discovery and keeps it up to date as the databases change.